Rates Based on Small Numbers - Statistics Teaching Tools
Why are rates based on fewer than 20 cases marked as being unreliable?
Incidence and mortality rates reported by programs in the Division of Chronic Disease Prevention and Adult Health often are marked as being unreliable if they are based on fewer than 20 cases or deaths. Similarly, the National Center for Health Statistics does not publish or release rates based on fewer than 20 observations, because they feel these data do not meet their requirement for a minimum degree of accuracy. They base the accuracy requirement on a measure called the relative standard error (RSE). The RSE is the standard error as a percent of the measure itself. (This is very similar to a coefficient of variation, which is the standard deviation divided by the measure). A RSE of 50 percent means that the standard error is half the size of the rate.
The following calculations show that the RSE of an incidence or mortality rate is based completely on the number of cases or deaths, unlike the standard error, which is based on both the number of cases and the size of the population. The calculation is shown for crude rates (un-adjusted rates), but it can also be applied to age-adjusted rates.
For crude incidence and mortality rates, the RSE is calculated as follows:![]()
For crude rates, the standard error is calculated as follows:![]()
so the relative standard error is:![]()
EXAMPLE:
There are 20 testicular cancer deaths among males in New York State, excluding New York City, every year. The rate of testicular cancer deaths is 0.4 per 100,000 males, and the standard error is 0.09. The relative standard error is 22 percent.
There are about 20 prostate cancer deaths among males in Orange County every year. The rate is 21.9 deaths per 100,000 males; the standard error is 4.8. Again, the relative standard error is 22 percent.
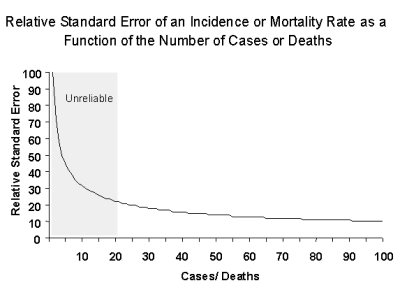
So even though the standard error for the testicular cancer rate is much smaller than the standard error for the prostate cancer rate, both have the same magnitude relative to the rate itself. The NCHS does not publish numbers or rates where there are fewer than 20 cases or deaths, corresponding to a RSE of approximately 22 percent. This may seem arbitrary until you examine the relationship between the RSE and the number of cases/deaths, which is displayed here graphically.

This is an inverse exponential function, which means that small changes in the number of deaths at the lower end of the scale have a much bigger effect than small changes at the large end of the scale: going from 10 deaths to 20 deaths reduces the RSE from 32 percent to 22 percent, while going from 60 deaths to 70 deaths reduces the RSE from 13 percent to 12 percent. It is somewhere around 20 deaths that the curve seen in figure 1 starts to level out. Hence, rates based on fewer that 20 deaths, in the steep end of the curve, are highly variable and for that reason unreliable.
What does this mean?
If an incidence or mortality rate is unstable, it should be interpreted with caution. When the rates are based on only a few cases or deaths, it is almost impossible to distinguish random fluctuation from true changes in the underlying risk of disease or injury. Therefore comparisons over time or between communities that are based on unstable rates can lead to spurious conclusions about differences in risk which may or may not be valid.
This is particularly an issue for communities with relatively small populations. Most programs in the Division of Chronic Disease Prevention and Adult Health do not calculate incidence or mortality rates for geographic areas smaller than counties because for many areas, the rates for even the most common diseases are not stable enough to be meaningful.
There are several ways to address this issue. One way is to combine the number of cases or deaths over several years so that the rates are based on a larger number of cases, for example, using five-year average annual rates instead of single year rates. Alternatively, the number of cases or deaths can be combined across geographic areas, for example, using the rate for a region instead of an individual county.
If the rates of disease or injury in a community are unstable, it is sometimes possible to gather other information about the risk of disease or injury that can be used to support program planning or interventions. For example, there may be only a few motor vehicle related fatalities in a county in any given year, but information about the number of motor vehicle crashes or drunk driving convictions can be used instead to determine if an intervention is necessary.
Finally, a statistical technique called indirect age-adjustment can be used when the number of cases or deaths is small. One example of this technique is to compare the number of cases or deaths registered for a community to what would be expected in that community. Indirect age-adjustment is not affected by unstable rates in the community. If only a few cases or deaths are expected in a community, however, this technique is not very sensitive to small increases in the number of observed cases or deaths.