Attachment L
Medicaid Hospital Global Budget Initiative Implementation Plan
- Attachment also available in Portable Document Format (PDF)
Implementation Plan Summary
The Implementation Plan below describes New York state's strategy for developing a robust Population Health and Accountability Plan which will inform strategies for hospital transformation across the state's Medicaid population in alignment with New York's 1115 demonstration Special Terms and Conditions (STCs). This Implementation Plan also describes alignment of quality metrics at the hospital and state level. Finally, it describes how the statewide Population Health and Accountability Plan will complement the State's activities under the State's Achieving Healthcare Efficiency through Accountable Design (AHEAD) Model.
The State will work with the Health Equity Regional Organization (HERO) to collect and analyze regional physical health, behavioral health, and social care needs and gaps in access to care, including those driven by workforce-related issues. As described under STC 13, the HERO, is a statewide entity designed to develop regionally-focused approaches to improving healthcare access, quality, and outcomes. The HERO is charged with conducting regional needs assessments to inform data-driven regional planning. This will include data collected through regional stakeholder engagement, as well as through data aggregation, analytics, and reporting based on data collected from stakeholders (e.g., Social Care Networks (SCNs), Workforce Investment Organizations (WIOs), Managed Care Organizations (MCOs), and providers). These deliverables will also be informed by HERO qualitative and quantitative research that supports the State in identifying promising models from other states and markets. The deliverables will further coordination between all entities, including hospitals, by establishing strategies for addressing population appropriate needs at the local level, thereby assisting all providers in connecting Medicaid members to appropriate services. The State will use this regional information to develop a statewide Population Health and Accountability Plan that focuses on gaps in access to care and improving population health outcomes across the state.
This planning will also align with population health-focused planning work under the 1115 Medicaid Hospital Global Budget Initiative and ultimately the AHEAD model.
Goals for healthcare transformation under 1115 Medicaid hospital global budget initiative:
- Use population demographics to evaluate the sub-state region's opportunities for population health improvement and care delivery efficiencies;
- Build a common agenda of initiatives with actionable, evidence-based strategies for increased healthcare access and improvement in population health outcomes across specific domains;
- Specify metrics and data sources for measurement of progress toward defined quality improvement targets;
- Establish a strategy for continuous communication with model participants and other stakeholders; and
- Memorialize these goals and document the State's commitments to improved health outcomes and population health strategies to ensure the maximum collective impact of the work of dedicated partners.
Additional goals for alignment with the AHEAD Model:
- Construct a Population Health and Accountability Plan for the 1115 demonstration that aligns with the AHEAD model requirements; and
- Ensure coordination across stakeholders by facilitating workflows across the SCNs, HERO, and AHEAD Model Governance Structure.
In addition to the quality strategy outlined below, the State's Population Health and Accountability Plan will align with State requirements under the AHEAD model. The AHEAD model incentivizes participating hospitals (including but not limited to the twelve hospitals receiving transformation funding through the 1115 demonstration) to improve quality of care, create efficiencies within their healthcare ecosystems, and constrain total cost of care for their patient populations. The State will work to ensure that hospitals use transformation funding to prepare for executing relevant AHEAD hospital global budget performance adjustments and other hospital requirements under the model, including the quality strategy described below.
Finally, the State is required under the AHEAD model to establish a Model Governance Structure to establish mechanisms for ongoing stakeholder engagement during AHEAD pre-implementation and performance. This Governance Structure will be comprised of an Executive Committee and Advisory Boards which will advise the State on the AHEAD Population Health and Accountability Plan and quality/population health targets. The statewide health Population Health and Accountability Plan required through the 1115 STCs will be written to inform the Model Governance Structure's strategies for addressing issues related to access and population health for Medicaid members in the state. Additionally, under the AHEAD model, the State will be held accountable for the certain quality measures on an all-payer basis. The State's Population Health and Accountability Plan will include aligned measures for statewide Medicaid quality improvement.
Quality Strategy
Overview of New York's Medicaid Hospital Global Budget Initiative
In alignment with the goals of CMMI's AHEAD model, the Medicaid Hospital Global Budget Initiative, authorized under New York's Medicaid Redesign Team Section 1115 Demonstration STCs, aims to provide incentive funding to help financially distressed safety net hospitals improve quality of care and make necessary preparations for successful participation in the AHEAD model. The goals of the program include:
- Stabilizing financially distressed voluntary hospitals;
- Improving population health in communities with the most evidence of health disparities;
- Improving quality of care through hospital transformation towards advanced alternative payment models; and
- Deepening integration with primary care, behavioral health, and Social Determinants of Health (SDOH) services.
Each hospital will establish a custom roadmap of key targeted activities required to transition to a global budget model, including considerations on where to invest and build, required partnerships, talent change management, and any technology gaps.
Hospital Quality Data Collection Goals
The State must include the quality measures selected for hospital-level reporting and performance, which must include some Pay for Performance (P4P) quality measures. The State will identify baseline data, adequacy, and needs in communities as part of this plan.
Hospital Metrics and Reporting Requirements
The hospitals will be held accountable to the following quality measurement and quality improvement efforts:
Table 2: Hospital Metrics and Reporting Requirements
| Metric | Data Source | Measure Steward | DY26 SFY 2025 (4/1/2024-3/31/2025) | DY27 SFY 2026 (4/1/2025-3/31/2026) | DY28 SFY 2027 (4/1/2026-3/31/2027) |
|---|---|---|---|---|---|
| Completion of Baseline Assessment (Yes/No) | N/A | P4R | |||
| Demographic Data Completeness - Core Variables (e.g., Race and Ethnicity) | SPARCS | NYSDOH | P4R | P4P | P4P |
| Demographic Data Completeness - Additional Variables (may include: Language Spoken, and if feasible, other dimensions to be determined) | SPARCS | NYSDOH | P4R | ||
| Screening for Social Drivers of Health | Hospital Data | CMS | P4R | P4R | P4P |
| Potentially Preventable Readmissions | SPARCS | 3M | P4R | P4R | P4R |
| Colorectal Cancer Screening | Practice Reported Data | NCQA | P4R | P4R | |
| Nulliparous women with a term, singleton baby in a vertex position delivered by cesarean birth (PC02) | Hospital Data | The Joint Commission | P4P |
Notes: P4R- Pay for Reporting; P4P- Pay for Performance; Screening for Social Drivers of Health measure aligns with FY 2024 Hospital Inpatient PPS final rule
Data Sources
Statewide Planning and Research Cooperative System (SPARCS) is a comprehensive all payer data reporting system established in 1979 as a result of cooperation between the healthcare industry and government. SPARCS currently collects patient-level detail on patient characteristics, diagnoses and treatments, services, and charges for each hospital inpatient stay.
Hospital data refers to data used at the hospital level to report the relevant metric. This information could come from the electronic health record system, internal data warehouse, administrative claims or supplemental data used to report the measure results.
Practice reported data refers to data collected by the practice using their electronic health record system. To align with reporting requirements for patient centered medical home (PCMH) practices, New York State Department of Health (NYS DOH) has completed an agreement with the National Committee for Quality Assurance (NCQA) so that practices who are reporting measures for annual reporting requirements can have this information passed to NYS for purposes of quality measurement at the practice-level.
Measure Descriptions
Demographic Data Completeness will be measured as the percentage of members with acute hospital stays within the measurement year with self-reported demographic data at or above 80 percent. The measure is reported as an inverted rate and higher performance is better.
Demographic data will include the following categories: race and ethnicity, primary language spoken, disability status, and may include language spoken and, as feasible, other dimensions, to be determined. Data completeness will be assessed separately for each data element: Demographic Data Completeness - Core Variables (e.g., Race and Ethnicity); Demographic Data Completeness - Additional Variables (e.g., Language Spoken, and other applicable demographic characteristics).
Screening for Social Drivers of Health will be measured as the percentage of patients admitted to an inpatient hospital stay who are 18 years or older on the date of admission and are screened for all the following five SDOHs: food insecurity, housing instability, transportation needs, utility difficulties, and interpersonal safety during their hospital inpatient stay. Individual hospital goals for quality improvement (improvement over self) will be reviewed and set based on initial assessments of baseline data. This measure has two components a screening rate and a screen positive rate.
Pay for Performance dollars will be based on the screening rate not on the screen positive rate.
Potentially Preventable Readmissions (PPR) will be measured as the number of initial hospital admissions followed by a clinically related hospital admission within a 14-day period. This measure includes all ages, excluding most newborns. A PPR may have resulted from a deficiency in the process of care and treatment at the initial hospitalization or lack of post discharge follow up. PPRs are not defined by unrelated events that occur post-discharge, such as admissions for trauma. For each hospital, the total number of at-risk admissions, the total number of observed PPR chains, the observed PPR rate, the expected PPR rate, and the risk adjusted PPR rate are calculated by year. Lower rates are better.
Colorectal Cancer Screening will be measured as the percentage of members 45 to 75 years of age who had appropriate screening for colorectal cancer.
Nulliparous women with a term, singleton baby in a vertex position delivered by cesarean birth (PC02) will be measured as the number of nulliparous women with a term, singleton baby in a vertex position delivered by cesarean section. Lower percentages are better.
Additional Detail on Reporting Metrics
To reduce administrative burden on hospitals the complete and timely submission of their SPARCS data, which includes patient demographic data in addition to the clinical data needed to calculate quality metrics meets the reporting requirement for the demographic data completeness metrics and Potentially Preventable Readmissions measure. The Data Submission Compliance Protocol provides guidance to facilities on how to achieve compliance for completeness (volume), timeliness, and accuracy (quality). Included in this document is information on the SPARCS Coordinator, the facilities that are required to submit data, the type of data required, and the required timelines for submission. Information is also provided on the reconciliation process, and how the SPARCS Program and facilities work together to resolve technical or policy issues impacting compliance.
This document should be consulted in conjunction with the SPARCS Data Submission System Overview.
Due to licensing requirements and the need for compiled hospital data to track readmissions to different facilities than the original discharge, New York will calculate the measure results for the Potentially Preventable Readmissions measure. Hospital-Specific Reports (HSRs) will be shared with hospitals annually.
As a part of the Hospital Inpatient Quality Reporting (IQR) Program CMS requires hospitals to submit data on the Screening for Social Drivers measures to CMS each year. New York will use the publicly available files from the Hospital IQR Program for the reporting of the quality data for this measure.
Hospital Performance Methodology
New York will hold each participating hospital individually accountable to all hospital metrics. The hospital performance methodology is outlined below. The state reserves the right to adjust the methodology annually as needed, which may include but is not limited to the addition of new measures, or the transition of existing measures from pay-for-performance to pay-for-reporting if measures are unable to be trended or there are extenuating circumstances impacting performance. Any changes will be communicated in writing to CMS.
Points and Scoring
- There are a total of 100 points available for the program and each measure has an allotted number of points as outlined in Table 3.
- For Demographic Data Completeness measures with more than one indicator, a weighted average method will be used (see equation below) to average each measure's individual indicator rates and calculate a measure score.
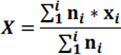
Where X is the final measure score that is the weighted average, xi is the indicator score, and ni is the indicator denominator.
Example Data:
| Measure Indicator | Numerator | Denominator | MeasureScore* |
|---|---|---|---|
| Demographic Data Completeness: Primary Language Spoken | 789 | 4500 | 83 |
| Demographic Data Completeness: Disability Status | 330 | 4500 | 93 |
| Demographic Data Completeness Composite | 1119 | 9000 | 88 |
* Calculated as 1- (numerator/denominator)
Pay-for-reporting (P4R)
- P4R measures will be assessed on a pass/fail basis for which the hospitals who successfully report complete and timely data will receive full points for the metric.
Pay-for-performance (P4P)
- New York will establish performance benchmarks no later than the start of the first pay-for-performance period for the metric. Benchmarks for quantitative measures will include an attainment threshold and will be set to apply to the full applicable performance period.
- New York will establish annual performance improvement targets for performance metrics by hospital, as applicable, no later than the start of each pay-for performance period for the metric.
- Hospitals will receive a "met" or "not met" designation for each measure. Hospitals have two ways to earn a "met" designation for each measure:
- If the hospital meets the established benchmark for the measure, or
- If the hospital meets the established improvement target
- Establishment of benchmarks will vary by measure and be informed by inputs such as initial baseline data, historical hospital data, external data/trends, and/or predetermined performance targets determined by New York. For example, demographic data completeness measures benchmarks are set at or above 80%.
- The approaches and actual improvement targets will differ by measure; approaches may include year-over-year self-improvement, gap-to-goal percentage point increase, absolute percentage point increases, set milestones and/or goals for improvement. Once baseline data is collected improvement targets will be set and communicated to hospitals.
- If a measure has less than 30 members in the denominator, we consider it to be a Small Sample Size (SS), and we will suppress those results. There will be no reweighting for SS. If results are SS, there will be an overall reduction of base points. For example, with 5 measures each worth 20 points out of 100 possible total points, if the hospital only has 4 measures with sufficient sample, the base will be reduced by the maximum value for that one measure 20 points per measure out of 80 possible total points.
Table 3: Hospital Metric Points by Demonstration Year
Note: Gray shade and italics indicates P4P in the table below.
| Measure Points by Performance Year | ||||
|---|---|---|---|---|
| Domain | Metric | DY26 SFY 2025 (4/1/2024-3/31/2025) |
DY27 SFY 2026 (4/1/2025-3/31/2026) |
DY28 SFY 2027 (4/1/2026-3/31/2027) |
| Quality | Completion of Baseline Assessment (Yes/No) | 10 | n/a | n/a |
| Demographic Data Completeness - Core Variables (e.g., Race and Ethnicity) | 10 | 10 | 10 | |
| Demographic Data Completeness - Additional Variables (which may include language spoken and, as feasible, other dimensions, to be determined) | n/a | n/a | 10 | |
| Screening for Social Drivers of Health | 40 | 40 | 20 | |
| Potentially Preventable Readmissions | 40 | 40 | 20 | |
| Colorectal Cancer Screening | n/a | 10 | 20 | |
| Nulliparous women with a term, singleton baby in a vertex position delivered by cesarean birth (PC02) | n/a | n/a | 20 | |
| Total Points | 100 | 100 | 100 | |
Final Scoring
- The total number of points earned by each hospital for each measure are summed and then divided by the total points and multiplied by 100 to calculate the final score.
- The final score for each hospital will drive the amount of award each hospital will receive see Table 4.
Table 4. Percent of Award by Range of Scores
| Percent of Award | Range of Scores |
|---|---|
| 100% | 76-100 |
| 75% | 51-75 |
| 50% | 26-50 |
| 25% | 0-25 |
Funding by Demonstration Year
| Quality Metric Allocation | DY26 SFY 2025 (4/1/2024-3/31/2025) |
DY27 SFY 2025 4/1/2024-3/31/2025) |
DY28 FY 2025 (4/1/2024-3/31/2025) |
|---|---|---|---|
| Percent of Total 1115 Medicaid Hospital Global Budget Initiative Funding | 25% | 35% | 50% |
| Allocation for Quality Metrics | $138 M | 赡 M | $275 M |
Each year, a portion of the $550 million (total computable) will be allocated toward quality measurement. The share of funding will grow over time as some metrics move from pay-for-reporting to pay-for performance.
