New York State Census of Fatal Occupational Injuries 1992-2000
A complete copy of the Census of Occupational Injuries (1992-2000) is available as an Adobe Portable Document (PDF) format. (211 KB)
New York State Department of Health
In Cooperation with the
U.S. Department of Labor
Bureau of Labor Statistics
June 2003
Executive Summary
From 1992 to 2000, there were 1,282 work-related deaths reported in New York State (excluding New York City). More than 90% of these fatalities involved men. On average, the construction and agriculture industries had the highest numbers of fatalities. Transportation-related accidents were the most common cause of death among both males and females.
Trend analysis was conducted on data collected by the New York State Census of Fatal Occupational Injuries (CFOI) program from 1992 to 2000. Overall, decreases were seen in homicides as well as fatal injuries to those working in service and technical, sales, and administrative support occupations. Increases were seen in occupational fatalities caused by the victim being struck by a falling object and being involved in a collision between vehicles. An increase was also seen in deaths involving motorized highway vehicles, specifically trucks.
Data generated from the CFOI program, such as those presented in this report, will be used by health and safety professionals to develop strategies for prevention of both fatalities and serious injuries in the future and can be useful in the development of priorities for public health programs in the coming years.
Introduction
The Occupational Safety and Health Act of 1970 requires the Secretary of Labor to collect, compile and analyze occupational safety and health statistics. Since 1972, the U.S. Bureau of Labor Statistics (BLS), in cooperation with state agencies, has collected injury, illness and fatality statistics.
In 1991, BLS developed the "Census of Fatal Occupational Injuries" (CFOI) program to address the need for an accurate count of work-related fatalities. CFOI, initially implemented in 32 states in 1991, is a joint effort between federal and state governments. Currently, BLS has the commitment of all 50 states, New York City, Washington D.C., Puerto Rico and the Virgin Islands. New York State (excluding New York City) enrolled in the CFOI program in 1993 and collected data retrospectively for 1992.
CFOI Program
The goal of CFOI is to collect verifiable information on occupational fatalities in a comprehensive and timely manner. CFOI utilizes multiple sources to identify, verify and profile occupational fatalities. Sources of information include death certificates, Workers' Compensation forms, newspaper articles, coroner and medical examiner reports, and law enforcement agencies including local and State police and sheriff's offices. Multiple sources are used in order to provide as complete and accurate information concerning workplace fatalities as possible.
Another important feature of CFOI is the dissemination of the collected information, without personal identifiers, to federal, state and local officials who plan intervention programs, as well as safety and health researchers involved in promoting workplace safety.
Certain criteria must be met in order for a death to be included in CFOI. The fatality must be verified by at least of two independent sources. The decedent must have been employed at the time of the event, and engaged in a work activity or have been present at the site of the incident as a requirement of the job. This broad definition is intended to capture all work-related fatalities that occur while a person is engaged in work. Excluded from the analysis are deaths resulting from occupational illnesses such as mesothelioma and asbestosis.
A complete count of occupational injury deaths occurring in each state during the reference year is compiled for the CFOI program. The count covers all fatal injuries determined to be work-related based on the above criteria; other fatalities that occur at work, including heart attacks and strokes, are also included in the database for research purposes.
The data examined in this publication are fatalities that occurred as the result of traumatic injuries. A traumatic injury is defined as "any unintentional or intentional wound or damage to the body resulting from acute exposure to energy- such as heat or kinetic energy from a crash or a fall- or from the absence of such essentials as heat or oxygen caused by a specific event, incident, or series of events within a single workday or shift".1 Cases involving heart attacks or strokes are considered injuries if a traumatic work injury was listed as a contributory or underlying cause of death on the death certificate or other medical report.
Information gathered for each fatality includes:
- Employment characteristics: industry type and size, ownership and occupation of employee;
- Fatal incident and its circumstances: nature of injury, part of body affected, source of injury and equipment or machinery involved;
- Demographic characteristics: race, age and sex of the deceased.
Data must meet certain confidentiality requirements in order to be published. The current publication rule for CFOI is that one or both of the following conditions must be met to publish data:
- there are 5 fatalities in a given category; or
- there are 3 separate incidents in the category.
New York State Workplace Fatalities, 1992-20002
There were 1,282 work-related deaths reported from 1992 to 2000 in New York State (excluding New York City).
Data generated from the CFOI program are useful in monitoring trends of work-related hazards and are used to identify high-risk industries and occupations. Data are also used to develop strategies for preventing both occupational fatalities and serious injuries from occurring in the future.
This report includes tables and charts outlining demographic and occupational characteristics and the circumstances surrounding injuries that led to deaths. New York City data are collected and analyzed separately by the New York City Department of Health and are not included in this report. Totals for major categories may include subcategories not shown separately, and percentages may not add to 100 because of rounding. Numerical data from 1992 to 2000 are presented in tabular format in Appendix A.
Data were analyzed using SAS v8.1. Trend analysis was performed using a t test for simple linear regression. Statistical significance was defined as a two-tailed p-value of <0.05.
It is important to note that the number of deaths reported for 1996 (n=126) excludes 46 work-related deaths that resulted from a commercial airline accident that year. Within this group were airline attendants and pilots (n=40). An additional six individuals were traveling for various business reasons. These 46 fatalities were excluded from data analysis as it was felt that if included, the data would be skewed and difficult to interpret. From a standpoint of public health, this event was not preventable and had the data on the victims of this single tragic event been included, preventable public health concerns may have been masked.
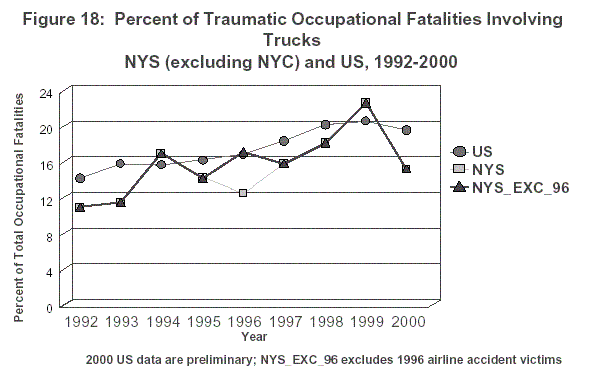
Figures 2, 7-9, 11-13, and 18 comparing national data to New York State data show three lines- one representing national data3, a second representing NYS data including the 1996 airline accident victims, and a third representing NYS excluding the 1996 airline accident victims. The 1996 airline accident victims are included in these figures only as a comparison to national data (which includes these individuals) but were not included in trend analysis.
Highlights
From 1992 through 2000:
- More than 90% of all occupational fatalities involved men.
- On average, approximately one-fourth of all occupational fatalities in New York State occur among the self-employed, including those working in family businesses. A large percentage of these fatalities involve the young and the elderly.
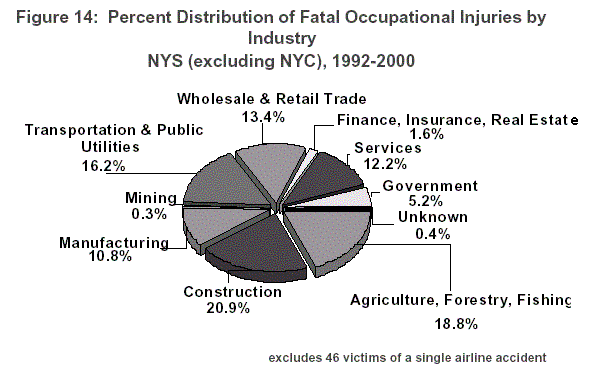
- On average, the construction and agriculture industries had the highest numbers of fatalities (268 or 20.9%, and 241 or 18.8%, respectively).
- The most common cause of death among males was transportation-related accidents (42.3% of deaths). Transportation-related accidents were also the leading cause of death among women (43.0% of deaths).
- For all deaths, (males and females):
- There was a statistically significant decrease in occupational fatalities due to assaults and violent acts, specifically homicides. This was accompanied by a statistically significant decrease in deaths resulting from gunshot wounds.
- There was a statistically significant increase in occupational fatalities caused by the victim being struck by a falling object.
- There was a statistically significant increase in work-related deaths from collisions between vehicles.
- There was a statistically significant increase in deaths involving motorized highway vehicles, specifically trucks.
- There was a statistically significant decrease in occupational fatalities among those working in service occupations as well as among those working in technical, sales, and administrative support occupations. This is largely due to the decrease in workplace deaths as a result of homicide.
- Nearly 84% of the cases reported to the CFOI program were injured and died within 24 hours.
Results
Employee Characteristics
Figures 1 through 5 display the sex, employee status, age and race of fatally injured workers in New York State, excluding New York City, for 1992 through 2000.
More than 90% of the occupational fatalities involved men (Figure 1). The most common cause of death in this group was transportation-related accidents, which accounted for 42.3% of deaths among males. Transportation-related accidents were also the leading cause of death among women (43.0%). Assaults and violent acts account for a large percentage of deaths to females (36.0%).
From 1992 to 2000, there was a statistically significant decrease in the percentage of deaths to females when the 1996 airline accident victims are excluded (p=0.0224) (Figure 2); this was largely due to a decrease in the number of homicides that have occurred over the nine-year period. When homicides are excluded from analysis, this trend is no longer evident.
A review of employee status data reveals that, while wage and salary workers represent the largest percentage of occupational fatalities, approximately one-quarter of fatally injured workers were self-employed or working in a family business (Figure 3).
Together, the young and the elderly comprise a substantial percentage of those who are self-employed or working in a family business. Thirty-one percent of those fatally injured while self-employed or working in a family business were workers younger than 18 (3.9%) or workers age 65 years or older (27.0%) (data not shown).
Figure 4 shows the number of occupational fatalities by age group for 1992-2000. The largest numbers of deaths occurred among those aged 35-54, however a large number of fatally injured workers were workers aged 55 years and over.
The percent distribution of fatal occupational injuries by race4 is displayed in Figure 5. Approximately 81% of occupational fatalities are among Whites while Blacks account for 6.3% of work-related fatalities. Fatal injuries to Hispanic/Latino workers comprise 6.2% of total occupational fatalities.
Event/Exposure
Transportation accidents accounted for the largest percentage of occupational fatalities from 1992 to 2000, with 42.3% of deaths occurring as a result of this event (Figure 6). Other major causes of death were contact with objects or equipment (17.4%), assaults and violent acts (14.7%), and falls (12.2%).
Trend analysis of 1992-2000 event/exposure data (excluding 1996 airline accident victims) reveals that there has been a statistically significant increase in deaths due to contact with objects and equipment largely due to an increase in fatal injuries resulting from victims being struck by a falling object (p=0.0096) (Figure 7). Forty-three percent of these incidents involved being struck by falling trees or logs.
There was also a statistically significant increase in deaths due to collision between vehicles and mobile equipment (excluding 1996 airline accident victims) (p=0.0250) (Figure 8).
From 1992 to 2000 (excluding 1996 airline accident victims), New York State experienced a statistically significant decrease in the percent of occupational fatalities due to assaults and violent acts largely due to the decline in homicides (p=0.0005) (Figure 9). This corresponds with the national decrease in work-related deaths due to homicide.
Occupation
Figure 10 displays the occupational groups within which the fatal injury occurred. Operator, fabricator and laborer occupations, a group which includes machine operators, motor vehicle operators, and construction laborers, represent the largest percentage of total fatalities (34.9%), followed by those working in farming, forestry and fishing occupations (19.9%).
Trend analysis of work-related fatalities from 1992 to 2000 (excluding 1996 airline accident victims) reveals a statistically significant decrease in deaths to those employed in service occupations (p=0.0192) (Figure 11) as well as to those employed in technical, sales, and administrative support occupations (p=0.0258) (Figure 12).5 These decreasing trends are largely due to the decrease in workplace deaths as a result of homicide. When homicides are excluded from analysis, these trends are no longer evident.
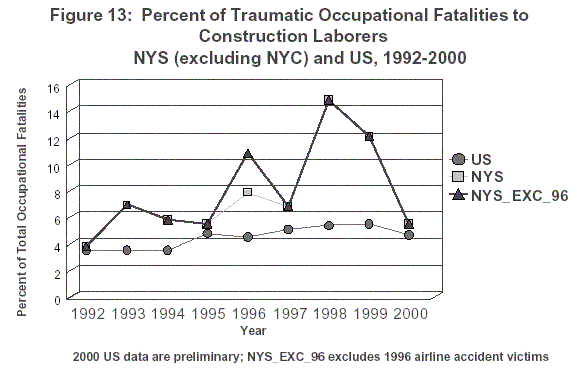
It is important to note that from 1992 to 1999 only (excluding 1996 airline accident victims), there was a statistically significant increase in fatalities to those in operating, fabricating, and laboring occupations, specifically among construction laborers (p=0.0168) (Figure 13). A small increase in deaths to those in laboring occupations, excluding construction, was also noted during this time period.6 When 2000 data are added, these trends are no longer statistically significant.
Industry
Figure 14 displays the percent of occupational fatalities by industry group. The largest number of fatalities occurred in the construction industry (20.9%) and the agriculture, forestry and fishing industry (18.8%).
Nature
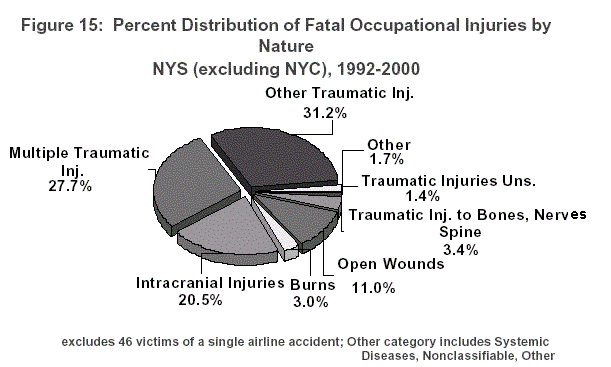
In terms of the nature of the fatal occupational injury, the largest percentages of workers die as a result of multiple traumatic injuries and disorders and from other traumatic injuries and disorders (a category which includes asphyxiations, strangulations and suffocations; electrocutions and electric shocks; and internal injuries to organs and blood vessels of the trunk) (Figure 15).
Trend analysis of 1992-2000 data (excluding 1996 airline accident victims) reveals a statistically significant decrease in deaths resulting from open wounds largely due to the decrease in deaths from gunshot wounds (p=0.0036). This coincides with the decrease seen in homicides as 71.6% of homicides involved gunshot wounds.
An increase in deaths resulting from intracranial injuries and injuries to internal organs is also evident however this increase is largely due to a change in coding from the more general "multiple traumatic injuries" to the more specific "intracranial injuries and injuries to internal organs".
Part of Body
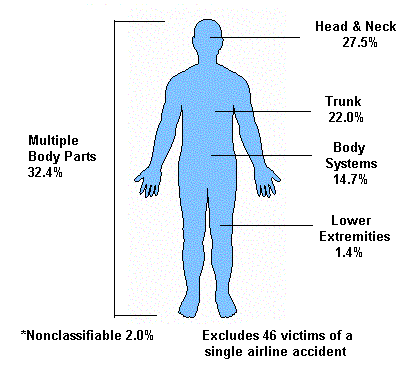
Figure 16 presents data on the body part to which the fatal occupational injury occurred. The largest percentages of deaths result from injuries to multiple body parts and the head and neck area.
Figure16: Percent Distribution of Fatal Occupational Injuries by Part
of Body
Source
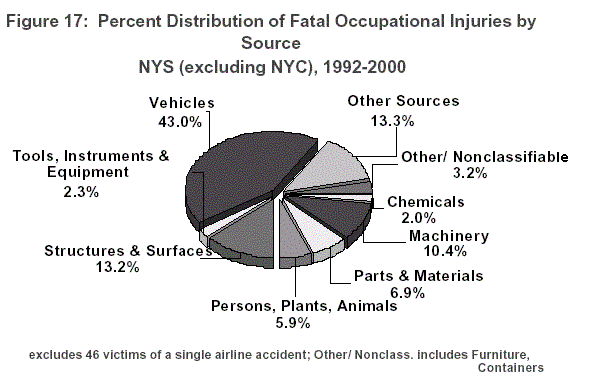
Vehicles, including air, highway and industrial powered vehicles were the most frequently reported source of fatal occupational injuries in New York State from 1992 to 2000 (Figure 17).
Trend analysis of 1992-2000 data (excluding 1996 airline accident victims) reveals a statistically significant increase in deaths involving motorized highway vehicles, largely due to an increase in fatalities involving trucks (p=0.0344) (Figure 18). Nationally, from 1992 to 1998, both the number of fatalities and the fatality rates of truckdrivers followed an increasing trend.7
At the other end of the spectrum, there has been a decrease in fatalities involving ammunition.7 This coincides with the decrease in the number of work-related fatalities attributable to homicide (Figure 9).
Month of Injury
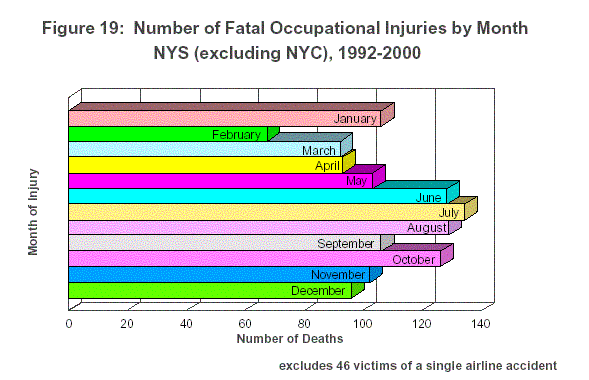
The largest numbers of workers in New York State were fatally injured during the summer months of June through August and in October (Figure 19).
The most common industries in which these summer and autumn fatalities occurred were the construction and agriculture, forestry and fishing industries; the most common occupations were operators, fabricators, and laborers and farming, forestry, and fishing. Approximately 36% of deaths in June through August were in operator, fabricator, and laborer occupations while 24% of deaths were in farming, forestry, and fishing occupations.
Latency Period
Nearly 84% of the cases reported to the CFOI program were injured and died within 24 hours�a fact that testifies to the severity of these workplace injuries.
County of Injury
The counties with the largest numbers of fatalities from 1992-2000 were Suffolk and Erie which each had greater than 100 fatalities over the nine year time period (Figure 20). Suffolk and Erie Counties have the first and third largest populations in New York State, respectively.8
Figure 20 is a map of the counties broken down by number of fatalities. This can be found in the complete Census of Fatal Occupational Injuries report which is available in a Adobe Portable Document Format (PDF).
Discussion
Deaths from traumatic occupational injuries represent a significant public health concern. Occupational fatalities represent enormous emotional and financial costs to both families and society. Work-related deaths are, however, preventable. Data generated from the CFOI program, such as those presented here, will be used by health and safety professionals to develop strategies for prevention of both fatalities and serious injuries in the future. Information regarding cause of death, type of industry, and type of occupation can be useful in the development of priorities for public health programs in the coming years.
Recently, CFOI data were used to set "target conditions" for the Fatality Assessment and Control Evaluation (FACE) project. In cooperation with the National Institute for Occupational Safety and Health (NIOSH), New York State is studying traumatic work-related fatalities by collecting information on factors leading to fatal injuries. Recommendations for prevention of future fatalities are made and distributed to employers, workers, and other organizations interested in promoting workplace safety. New York State FACE project staff evaluate occupational fatalities involving the young (under 18) and the elderly (60 years of age or older) with special priority being given to any fatality involving machinery or within the agriculture industry. These "target conditions" are subject to change as other public health priorities become apparent.
In addition to the trend analyses described throughout this report, other occupations experienced increases in fatalities over the nine-year time period, however the numbers were too small to report due to confidentiality requirements. These occupations included deaths to electricians and deaths to those working in forestry and logging occupations.
Fatalities involving trees and logs as well as parts and materials were also found to increase from 1992 to 2000 but again represented a small number of the fatalities experienced in New York State.
Although these fatalities represent a small minority of deaths in New York State each year, they must be held in consideration when developing intervention programs to address workplace deaths in the future.
Footnotes
| 1 | U.S. Department of Labor, Bureau of Labor Statistics. Census of Fatal Occupational Injuries State Operating Manual. March 1996 |
| 2 | New York State data does not include New York City fatalities. New York City collects and analyzes data separately. |
| 3 | National data was obtained from the Bureau of Labor Statistics (http://www.bls.gov - accessed 3/18/02) |
| 4 | Racial/ethnic categories were reported using the 2001 BLS format. In this new format, BLS/CFOI includes each case only once in the race and ethnicity totals. All Hispanics are listed under "Hispanic or Latino" and are not counted in any of the other race categories. In previous years, a category entitled "Hispanic ethnicity" was used in addition to the race categories. |
| 5 | The peak in 1996 represents the increased percentage of deaths to those working in these two occupation categories as a result of the airplane accident. The data on these airline-related fatalities were excluded from analysis. |
| 6 | Data do not meet publication criteria. |
| 7 | U.S. Department of Labor, Bureau of Labor Statistics. Fatal Workplace Injuries in 1998 and 1999: A Collection of Data and Analysis. August 2001. |
| 8 | U.S. Census Bureau. QuickFacts. Census 2000. |
Glossary
Administrative support (occupation):Agricultural services (industry):
Agriculture, forestry and fishing (industry):
Assaults and violent acts (event):
Atmospheric and environmental conditions (source):
Bodily reaction and exertion (event):
Body systems (part of body):
Caught in/crushed in collapsing materials (event):
Caught in (or compressed by) equipment/objects (event):
Chemical and allied products (industry):
Chemicals and chemical products (source):
Collisions between vehicles/mobile equipment (event):
Construction (industry):
Construction trades (occupation):
Contact with objects/equipment (event):
Containers (source):
Effects of environmental conditions (nature):
Electric, gas, and sanitary services (industry):
Employee status:
Executive, administrative, managerial (occupation):
Event:
Exposure to harmful substances/environments (event):
Falls (event):
Farming, forestry and fishing (occupation):
Finance, insurance and real estate (industry):
Furniture and fixtures (source):
General building contractors (industry):
Government (industry):
Handlers, equipment cleaners, helpers, and laborers (occupation):
Heavy construction (industry):
Highway accident (event):
Highway vehicles, motorized (source):
Homicide:
Illness:
Industrial powered vehicles (source):
Injury (traumatic):
Intracranial injuries (nature):
Latency period:
Machine operators, assemblers, and inspectors (occupation):
Machinery (source):
Managerial and professional specialty (occupation):
Manufacturing (industry):
Material handling machinery (source):
Mechanics and repairers (occupation):
Multiple traumatic injuries and disorders (nature):
N.E.C.:
Nature:
Noncollision accident (event):
Nonhighway accident (event):
Open wounds (nature):
Operators, fabricators, & laborers (occupation):
Other agricultural and related occupations:
Other service occupations:
Other sources (source):
Other traumatic injuries and disorders (nature):
Ownership:
Oxygen deficiency (event):
Part of body:
Parts and materials (source):
Persons, plants, animals (source):
Precision production (occupation):
Precision production, craft, and repair (occupation):
Professional specialty (occupation):
Protective service (occupation):
Retail trade (industry):
Self-inflicted injury (event):
Services (industry):
Services (occupation):
Special trade contractors (industry):
Source:
Struck by object (event):
Structures and surfaces (source):
Surface wounds and bruises (nature):
Systemic diseases and disorders (nature):
Technical, sales, and administrative support (occupation):
Technicians and related support (occupation):
Tools, instruments, and equipment (source):
Transportation and material moving (occupation):
Transportation and public utilities (industry):
Traumatic injuries and disorders, unspecified (nature):
Traumatic injuries to bones, nerves, spinal cord (nature):
Traumatic injuries to muscles, tendons, ligaments, joints, etc. (nature):
Trucking and warehousing (industry):
Trunk (part of body):
Uns.:
Vehicles (source):
Volunteer:
Wage and salary workers:
Wholesale trade (industry):
Work:
Work relationship:
Worker struck by vehicle (event):
Endnotes
1 U.S. Census Bureau. 1990 Occupational Classification System.
2 Executive Office of the President, Office of Management and Budget. Standard Industrial Classification Manual. 1987.
3 U.S. Department of Labor, Bureau of Labor Statistics. Occupational Injury and Illness Classification Manual. December 1992.
4 U.S. Department of Labor, Bureau of Labor Statistics. Census of Fatal Occupational Injuries State Operating Manual. March 1996.
Programs/Registries
The New York State Department of Health coordinates a number of occupational programs within New York, and monitors various occupationally related illnesses and injuries. Assistance is available for both employers and employees on a variety of occupational health issues. Descriptions of the programs are provided below.
New York State Network of Occupational Health Clinics
The New York State Department of Health coordinates a statewide network of occupational health clinics. The clinics help prevent occupational disease by providing diagnostic services, medical screening, treatment, referral and educational services for workers exposed to toxic substances and other occupational hazards. An additional health center dealing primarily with agricultural health is located in Cooperstown.
The Pesticide Poisoning Registry monitors both the acute and chronic effects of pesticide exposure. Occurrences of pesticide poisonings are investigated; consultation and diagnostic information is offered to physicians; and education and information about preventive practices are provided. Physicians and health care facilities must report confirmed or suspected pesticide poisonings within 48 hours. Clinical laboratories must report abnormally depressed cholinesterase levels and abnormally elevated tissue levels of pesticides within 48 hours.
The Heavy Metals Registry provides individuals with information regarding the potential adverse health effects of heavy metals. Industrial hygiene efforts are directed to both the employer, who has specific responsibilities to provide a safe workplace, and the employee, in the form of training about hazardous conditions and the use of protective equipment. Clinical laboratories, physicians and hospitals are required to report to the Heavy Metals Registry when conducting biological monitoring for arsenic, cadmium, mercury and lead. Further information is available from the New York State Department of Health, Bureau of Occupational Health.
Occupational Lung Disease Registry
Physicians are required to report suspected cases of occupational lung disease to the New York State Department of Health, Bureau of Occupational Health within 10 days of diagnosis. These diseases include pneumoconioses and other lung diseases from probably causative agents. For further information about the registry or to report a case, contact the OLDR by calling toll-free at 1-866-807-2130.
New York Fatality Assessment and Control Evaluation (NY FACE)
The New York Fatality Assessment and Control (NY FACE) program is one of many workplace health and safety programs administered by the New York State Department of Health (NYS DOH). It is a research program designed to identify and study fatal occupational injuries. Under a cooperative agreement with the National Institute for Occupational Safety and Health (NIOSH), the NY FACE program collects information on occupational fatalities in New York State (excluding New York City) and targets specific types of fatalities for evaluation. NY FACE investigators evaluate information from multiple sources. Findings are summarized in narrative reports that include recommendations for preventing similar events in the future. These recommendations are distributed to employers, workers, and other organizations interested in promoting workplace safety. The NY FACE program does not determine fault or legal liability associated with a fatal incident. Names of employers, victims and/or witnesses are not included in written investigative reports or other databases to protect the confidentiality of those who voluntarily participate in the program.


