County Heat and Health Profile Reports
New Yorkers are at risk of heat-related illness because summer temperatures are warming and our bodies are not used to long periods of extreme heat. County Heat and Health Profile Reports help identify areas at highest risk. These reports summarize county-level heat index trends, describe regional heat index where heat-related risks begin to increase, identify areas where populations are most vulnerable to extreme heat, and provide available adaptation resources. These reports can help communities prepare for and reduce heat-related illness.
For information about New York City’s Climate and Health, visit Climate and Health in NYC.
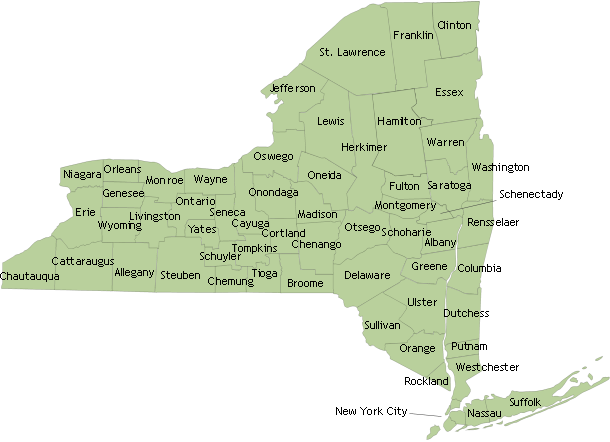
Select a county or click the map to view its Heat and Health Profile Report.
What is included in the County Heat and Health Profile Reports?
Local health departments, county emergency planning offices and local governments can use this information to support efforts towards mitigating the impacts of extreme heat. The reports provide a picture of heat index trends and future projections, regional heat index where heat-related risks begin to increase, socio-demographic and environmental vulnerability to heat, and availability of adaptation resources for each county, excluding New York City.
Exposure: Heat

Overall, temperatures and heat events across the state are expected to rise throughout the century.
Each report summarizes summertime temperature trends from 1980 to 2024. The graphs display the number of days with a maximum heat index of 85ºF or higher, how current temperatures differ from historical summertime averages, and the regional heat index levels at which heat related risks begin to increase. The reports also include projections of future temperatures. Visit the New York State Heat Surveillance Dashboard for daily monitoring of heat-related illnesses in the State during the summer.
Sensitivity: Health

Everyone has some level of risk for heat related health outcomes, but a person’s overall health affects how their body responds to extreme heat. For some people, that risk can start at lower temperatures during the summer.
Each report summarizes the daily heat index at which the risk of heat-related illness, kidney disease, and cardiovascular disease begins to increase for regions across the state. In some regions, the risk for heat related health outcomes starts at temperatures below 80°F. Learn more about heat and health in the New York State Heat and Health infographic.
Vulnerability: Community
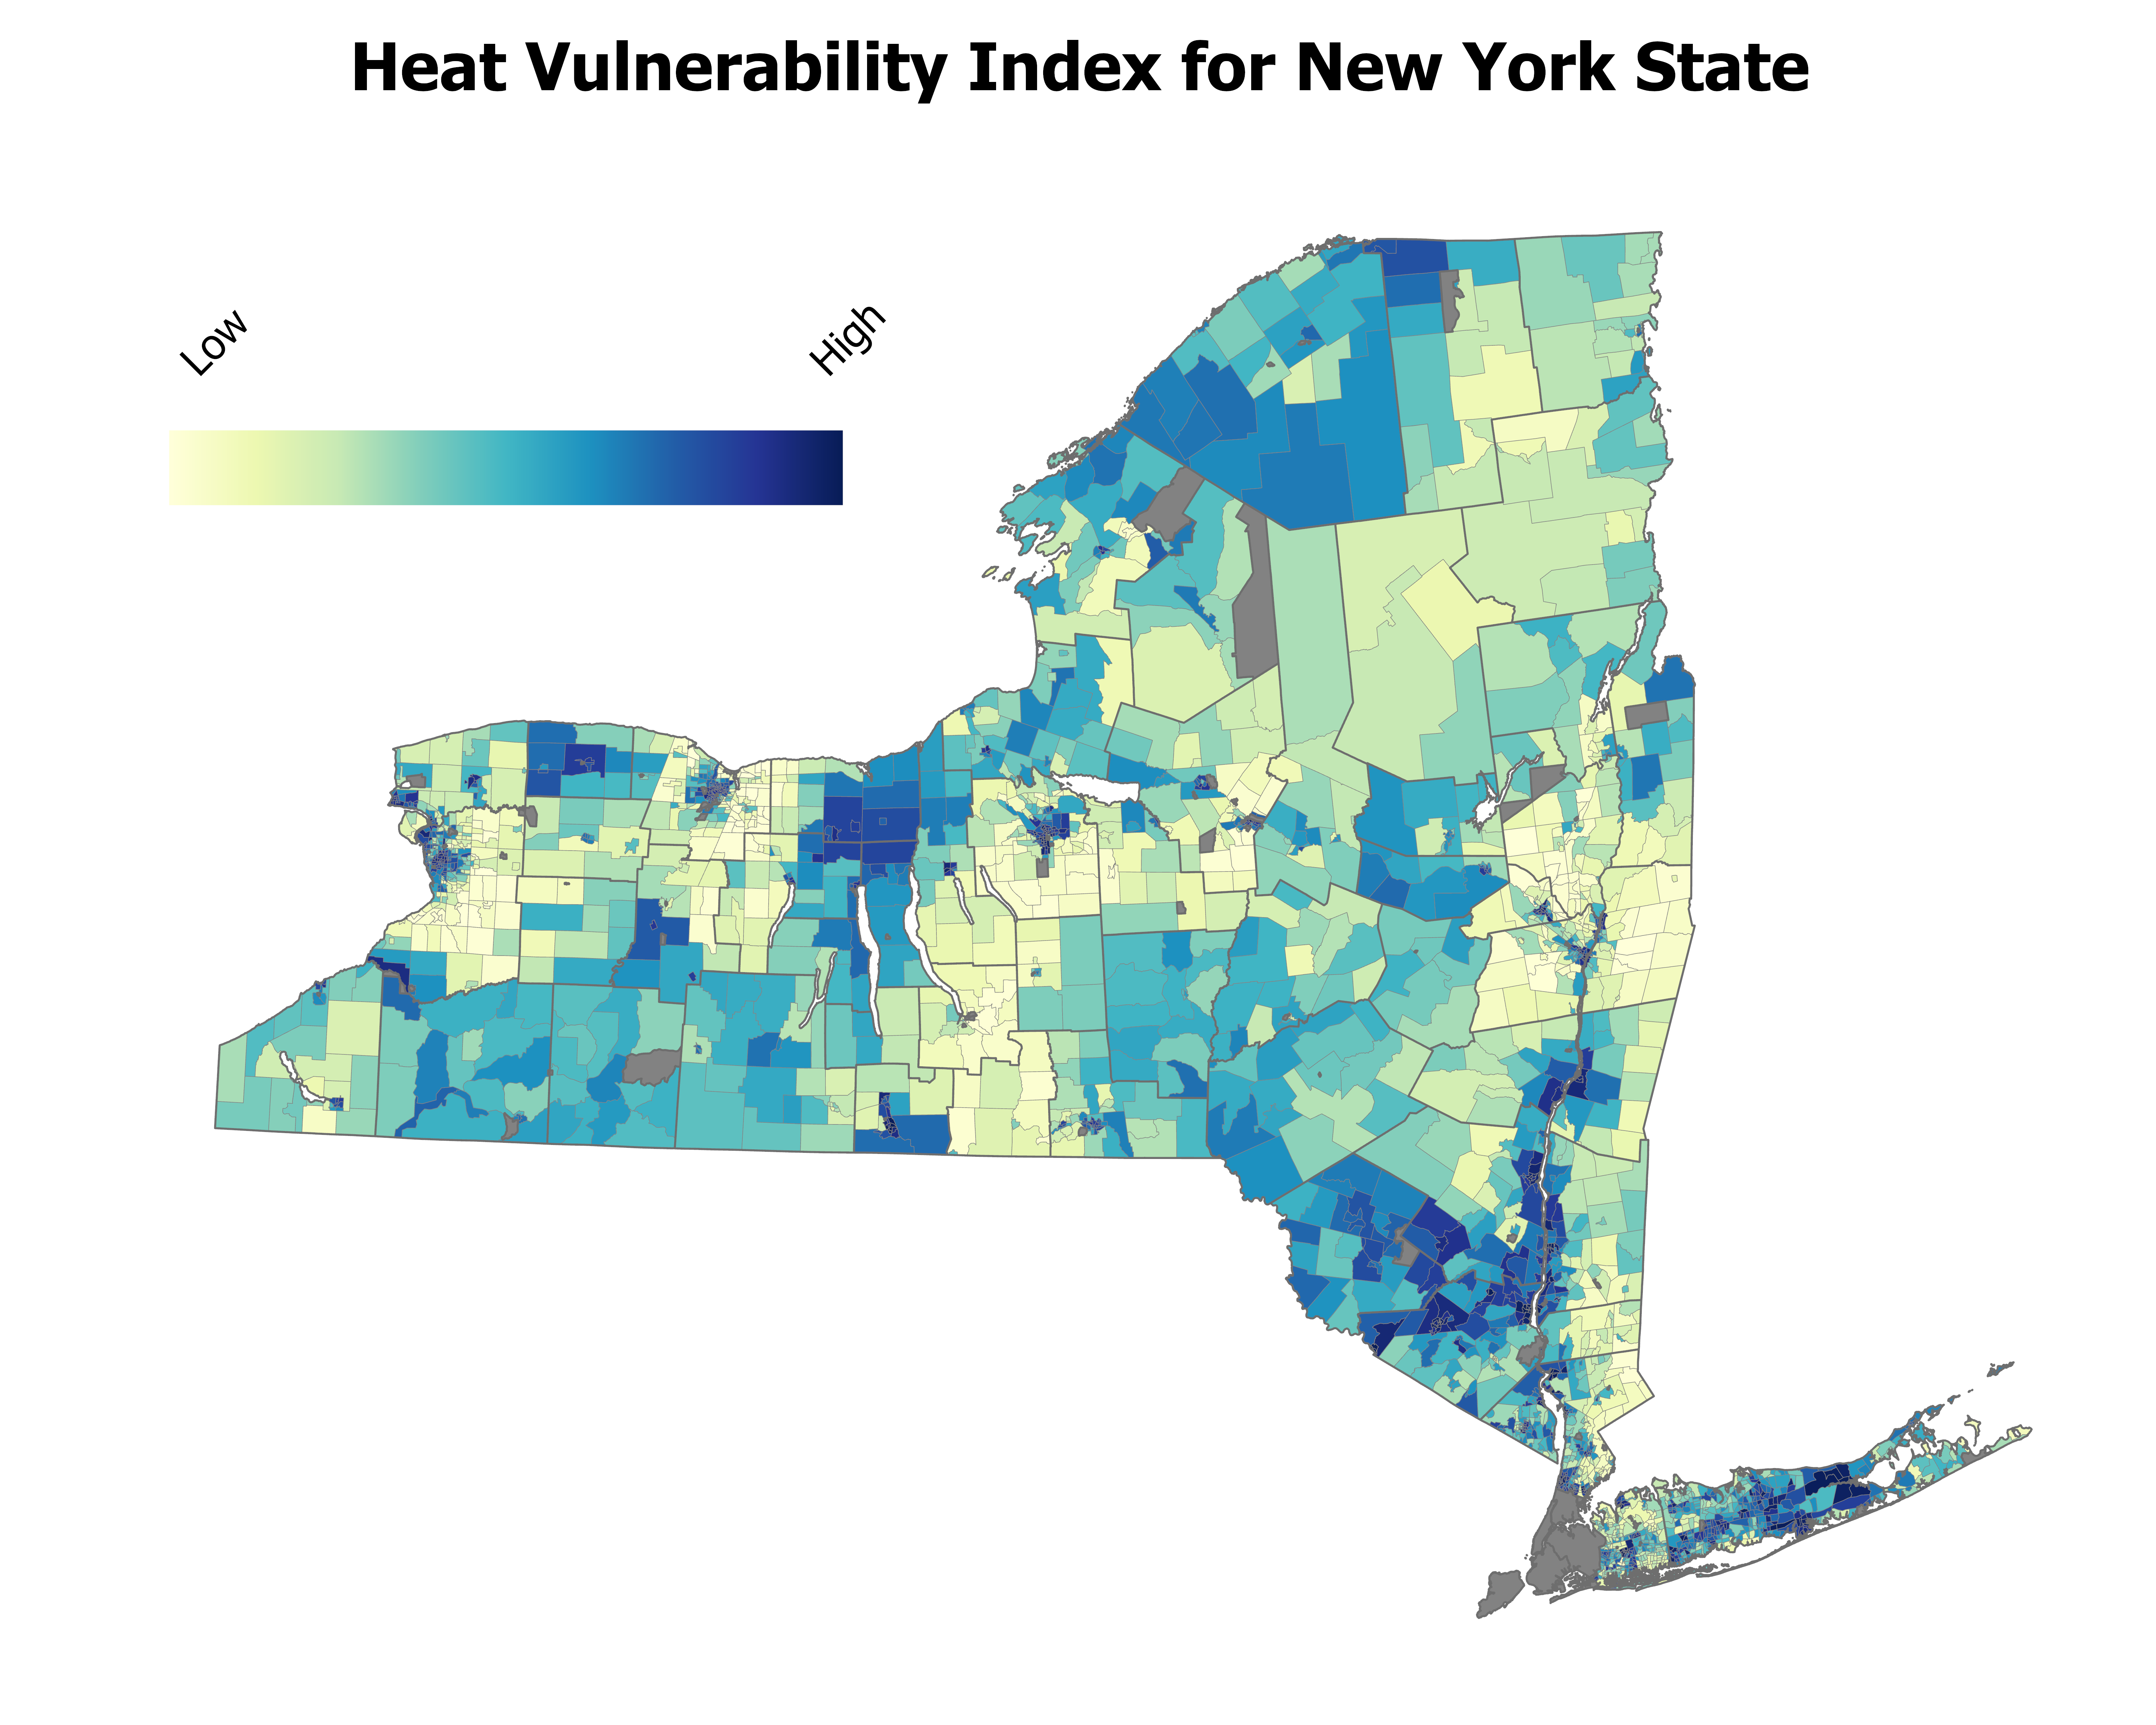
A community's demographic makeup and environmental characteristics influence how heat impacts health.
Each report describes three heat vulnerability factors: heat exposure, socio-demographics, and health outcomes. Together they estimate the county's overall Heat Vulnerability Index. Identifying these community-level vulnerabilities to heat can help allocate adaptation resources more efficiently.
Building Resilience: Prepare
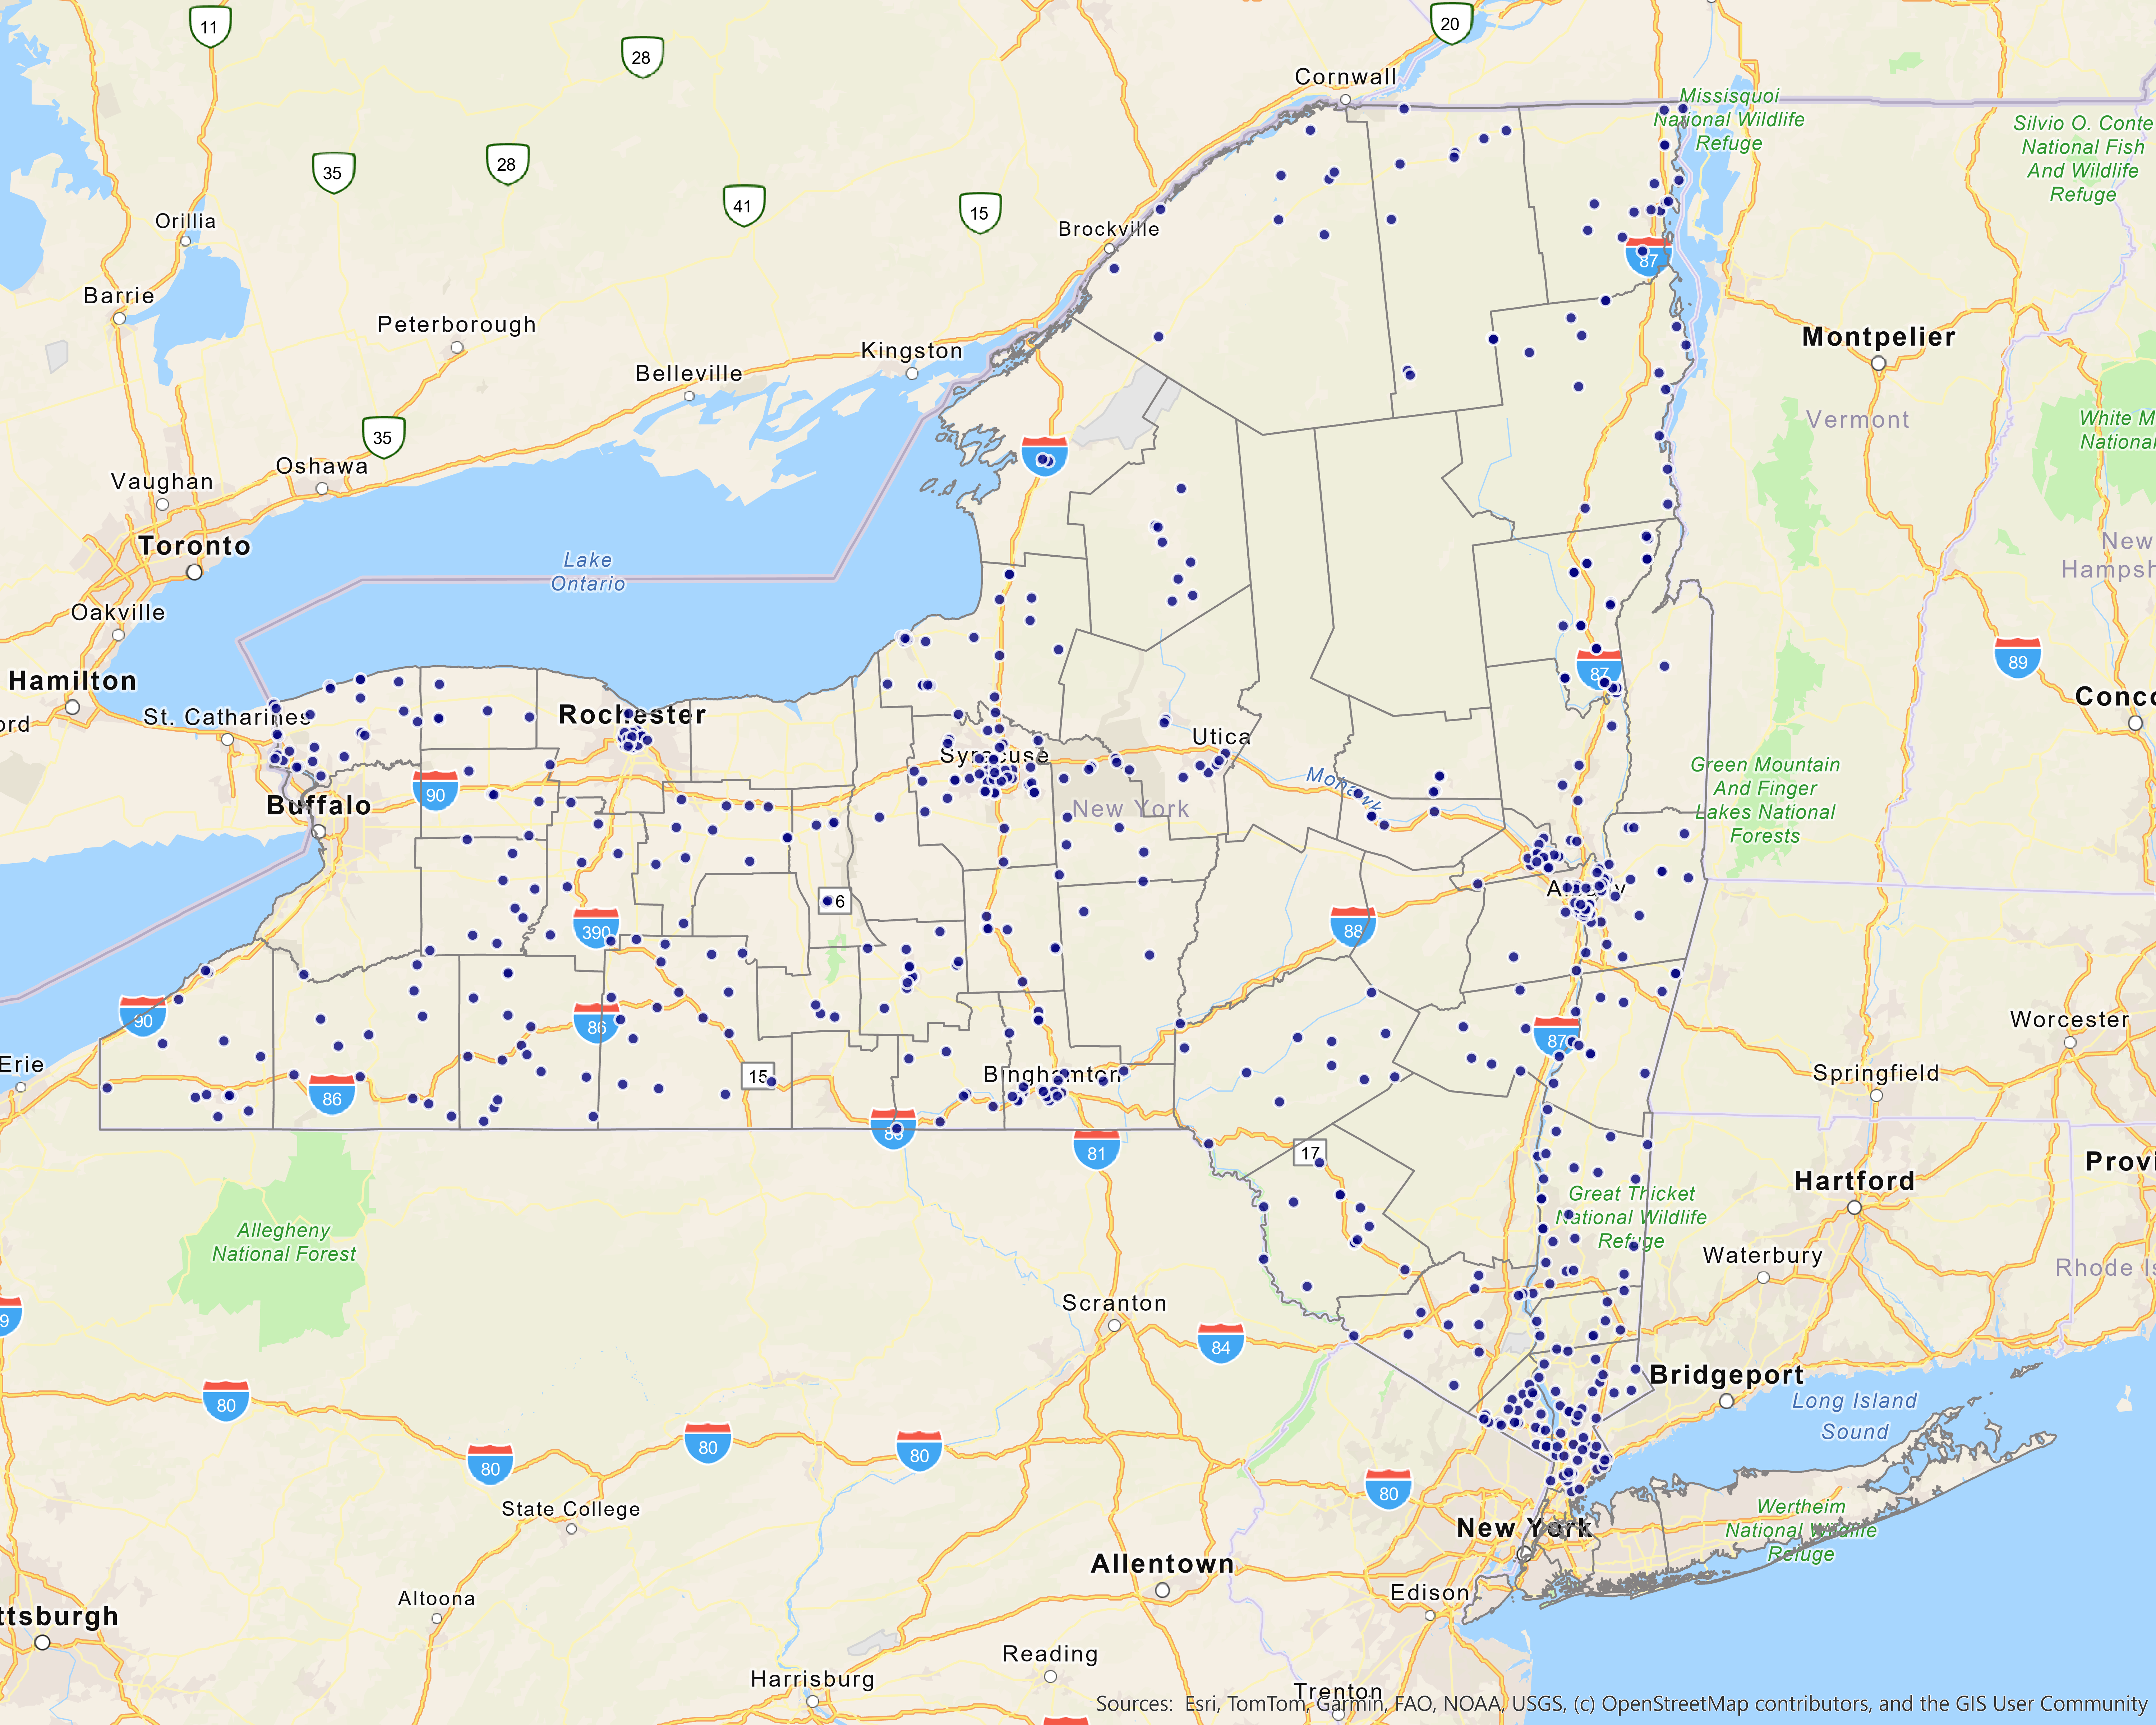
Heat-related illness and deaths can be avoided by spending time in air conditioning.
Each report highlights the importance of spending a few hours in a cool or air-conditioned place to reduce the impact of heat on health. Learn more about New York State Cooling Assistance and the Essential Plan Cooling Program through NY State of Health. In the absence of air-conditioning at home or work, cooling centers in the community are a valuable resource for cooling down during a heat wave. The profile contains links to information about places to get cool in each county.
