Delivery System Reform Incentive Payment (DSRIP)
PPS Project Valuation Webinar
- Presentation is also available in Portable Document Format (PDF)
October 29, 2015
Agenda
- Introduction
- Previous Webinars and Resources
- Example Project Valuation Datasheet – Forestland PPS
- Step–by–Step Example
- Next Steps
Introduction
PPS Project Valuation Breakdowns are intended to provided PPS with more detail regarding valuations by project.
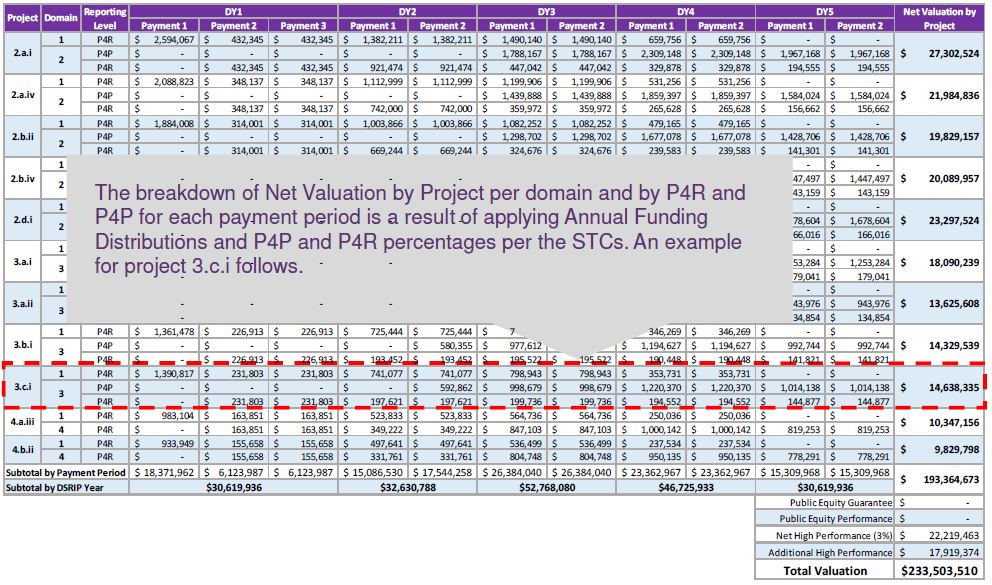
- DOH will be releasing PPS specific workbooks that show PPS anticipated valuation per project, per domain and by Pay for Reporting (P4R) and Pay for Performance (P4P) for each payment period.
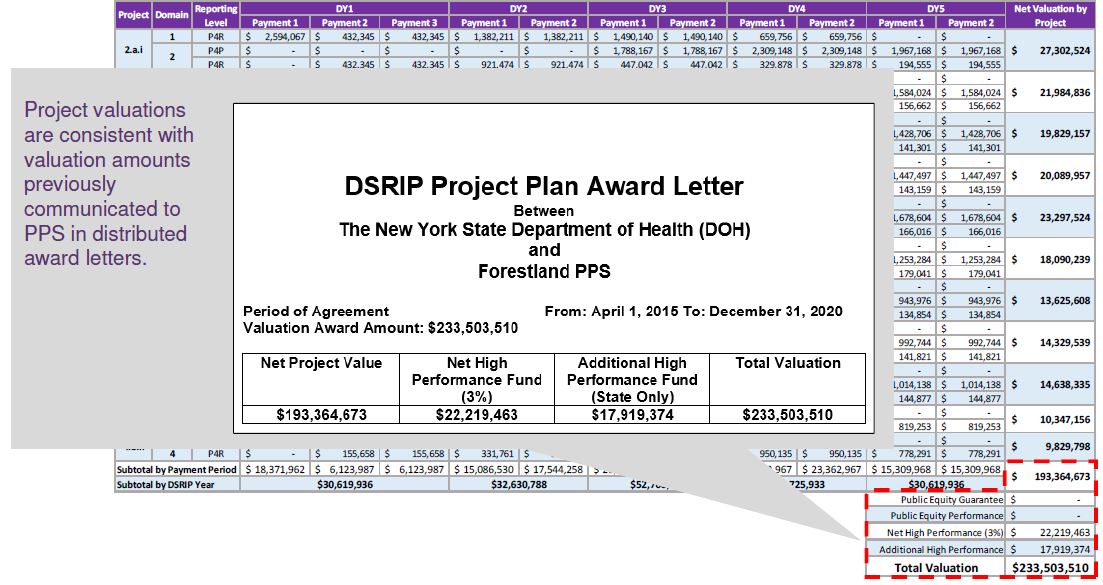
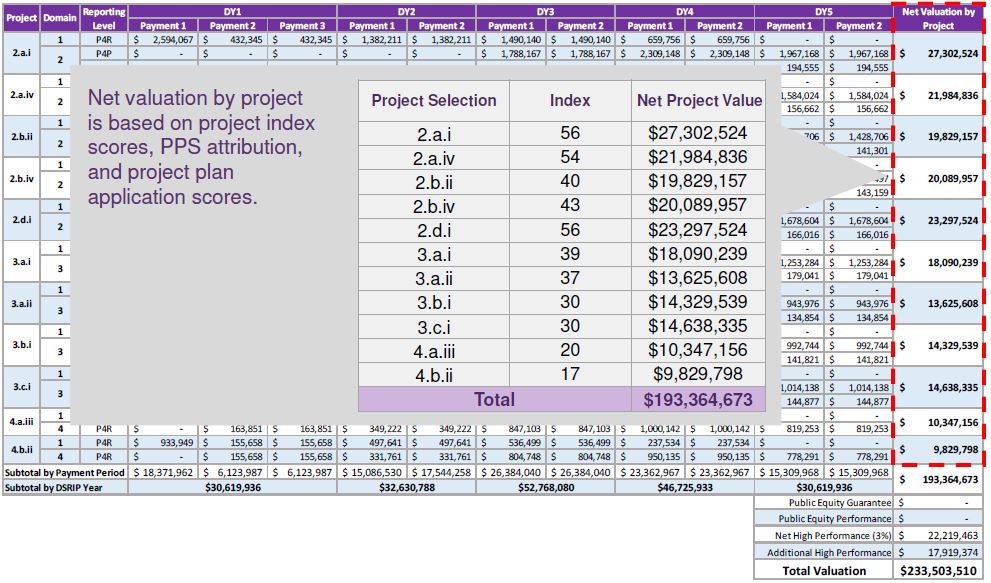
Project valuations are consistent with the total net DSRIP valuation amounts communicated to PPS in previously distributed award letters and are based on PPS’ DSRIP plan application score, PMPM, attribution, and DSRIP year funding percentages as specified in the CMS waiver special terms and conditions.
The evaluation of AVs and the calculation of payments will tie back to the project valuations and will ultimately be reflected in the AV Scorecard.
|top of section| |top of page|Previous Webinars and Resources
DOH has provided PPS with guidance regarding the calculation of payments and funding sources in previous webinars and presentations:
- Information about attribution methodology and the calculation procedures for project valuations can be found in the "DSRIP Update: New Project, Attribution and Valuation" webinar presented August 1, 2014
- Information about allocation of funds to P4P and P4R and an overview of the 5–year payment model can be found in the "Earning Payments D1–D4 AVs" webinar presented August 21, 2015
- Information about the High Performance Fund and Distribution Methodology was presented on September 24, 2015
- Information about the Equity Infrastructure, the Equity Performance and the Additional High–Performance Programs can be found in the "Supplemental DSRIP Programs – Equity Performance and Additional High Performance" presentation distributed to PPS leads through the DOH DSRIP e–mail October 7, 2015
Example Project Valuation Datasheet – Forestland PPS
| Project | Domain | Reporting Level | DY1 | DY2 | DY3 | DY4 | DY5 | Net Valuation by Project | ||||||
|---|---|---|---|---|---|---|---|---|---|---|---|---|---|---|
| Payment 1 | Payment 2 | Payment 3 | Payment 1 | Payment 2 | Payment 1 | Payment 2 | Payment 1 | Payment 2 | Payment 1 | Payment 2 | ||||
| 2.a.i | 1 | P4R | $ 2,594,067 | $ 432,345 | $ 432,345 | $ 1,382,211 | $ 1,382,211 | $ 1,490,140 | $ 1,490,140 | $ 659,756 | $ 659,756 | $ – | $ – | $ 27,302,524 |
| 2 | P4P | $ – | $ – | $ – | $ – | $ – | $ 1,788,167 | $ 1,788,167 | $ 2,309,148 | $ 2,309,148 | $ 1,967,168 | $ 1,967,168 | ||
| P4R | $ – | $ 432,345 | $ 432,345 | $ 921,474 | $ 921,474 | $ 447,042 | $ 447,042 | $ 329,878 | $ 329,878 | $ 194,555 | $ 194,555 | |||
| 2.a.iv | 1 | P4R | $ 2,088,823 | $ 348,137 | $ 348,137 | $ 1,112,999 | $ 1,112,999 | $ 1,199,906 | $ 1,199,906 | $ 531,256 | $ 531,256 | $ – | $ – | $ 21,984,836 |
| 2 | P4P | $ – | $ – | $ – | $ – | $ – | $ 1,439,888 | $ 1,439,888 | $ 1,859,397 | $ 1,859,397 | $ 1,584,024 | $ 1,584,024 | ||
| P4R | $ – | $ 348,137 | $ 348,137 | $ 742,000 | $ 742,000 | $ 359,972 | $ 359,972 | $ 265,628 | $ 265,628 | $ 156,662 | $ 156,662 | |||
| 2.b.ii | 1 | P4R | $ 1,884,008 | $ 314,001 | $ 314,001 | $ 1,003,866 | $ 1,003,866 | $ 1,082,252 | $ 1,082,252 | $ 479,165 | $ 479,165 | $ – | $ – | $ 19,829,157 |
| 2 | P4P | $ – | $ – | $ – | $ – | $ – | $ 1,298,702 | $ 1,298,702 | $ 1,677,078 | $ 1,677,078 | $ 1,428,706 | $ 1,428,706 | ||
| P4R | $ – | $ 314,001 | $ 314,001 | $ 669,244 | $ 669,244 | $ 324,676 | $ 324,676 | $ 239,583 | $ 239,583 | $ 141,301 | $ 141,301 | |||
| 2.b.iv | 1 | P4R | $ 1,908,787 | $ 318,131 | $ 318,131 | $ 1,017,070 | $ 1,017,070 | $ 1,096,486 | $ 1,096,486 | $ 485,467 | $ 485,467 | $ – | $ – | $ 20,089,957 |
| 2 | P4P | $ – | $ – | $ – | $ – | $ – | $ 1,315,783 | $ 1,315,783 | $ 1,699,135 | $ 1,699,135 | $ 1,447,497 | $ 1,447,497 | ||
| P4R | $ – | $ 318,131 | $ 318,131 | $ 678,046 | $ 678,046 | $ 328,946 | $ 328,946 | $ 242,734 | $ 242,734 | $ 143,159 | $ 143,159 | |||
| 2.d.i | 1 | P4R | $ 2,213,544 | $ 368,924 | $ 368,924 | $ 1,179,455 | $ 1,179,455 | $ 1,271,551 | $ 1,271,551 | $ 562,977 | $ 562,977 | $ – | $ – | $ 23,297,524 |
| 2 | P4P | $ – | $ – | $ – | $ – | $ – | $ 1,525,862 | $ 1,525,862 | $ 1,970,419 | $ 1,970,419 | $ 1,678,604 | $ 1,678,604 | ||
| P4R | $ – | $ 368,924 | $ 368,924 | $ 786,303 | $ 786,303 | $ 381,465 | $ 381,465 | $ 281,488 | $ 281,488 | $ 166,016 | $ 166,016 | |||
| 3.a.i | 1 | P4R | $ 1,718,790 | $ 286,465 | $ 286,465 | $ 915,832 | $ 915,832 | $ 987,344 | $ 987,344 | $ 437,145 | $ 437,145 | $ – | $ – | $ 18,090,239 |
| 3 | P4P | $ – | $ – | $ – | $ – | $ 732,666 | $ 1,234,180 | $ 1,234,180 | $ 1,508,149 | $ 1,508,149 | $ 1,253,284 | $ 1,253,284 | ||
| P4R | $ – | $ 286,465 | $ 286,465 | $ 244,222 | $ 244,222 | $ 246,836 | $ 246,836 | $ 240,430 | $ 240,430 | $ 179,041 | $ 179,041 | |||
| 3.a.ii | 1 | P4R | $ 1,294,596 | $ 215,766 | $ 215,766 | $ 689,807 | $ 689,807 | $ 743,670 | $ 743,670 | $ 329,258 | $ 329,258 | $ – | $ – | $ 13,625,608 |
| 3 | P4P | $ – | $ – | $ – | $ – | $ 551,846 | $ 929,587 | $ 929,587 | $ 1,135,941 | $ 1,135,941 | $ 943,976 | $ 943,976 | ||
| P4R | $ – | $ 215,766 | $ 215,766 | $ 183,949 | $ 183,949 | $ 185,917 | $ 185,917 | $ 181,092 | $ 181,092 | $ 134,854 | $ 134,854 | |||
| 3.b.i | 1 | P4R | $ 1,361,478 | $ 226,913 | $ 226,913 | $ 725,444 | $ 725,444 | $ 782,089 | $ 782,089 | $ 346,269 | $ 346,269 | $ – | $ – | $ 14,329,539 |
| 3 | P4P | $ – | $ – | $ – | $ – | $ 580,355 | $ 977,612 | $ 977,612 | $ 1,194,627 | $ 1,194,627 | $ 992,744 | $ 992,744 | ||
| P4R | $ – | $ 226,913 | $ 226,913 | $ 193,452 | $ 193,452 | $ 195,522 | $ 195,522 | $ 190,448 | $ 190,448 | $ 141,821 | $ 141,821 | |||
| 3.c.i | 1 | P4R | $ 1,390,817 | $ 231,803 | $ 231,803 | $ 741,077 | $ 741,077 | $ 798,943 | $ 798,943 | $ 353,731 | $ 353,731 | $ – | $ – | $ 14,638,335 |
| 3 | P4P | $ – | $ – | $ – | $ – | $ 592,862 | $ 998,679 | $ 998,679 | $ 1,220,370 | $ 1,220,370 | $ 1,014,138 | $ 1,014,138 | ||
| P4R | $ – | $ 231,803 | $ 231,803 | $ 197,621 | $ 197,621 | $ 199,736 | $ 199,736 | $ 194,552 | $ 194,552 | $ 144,877 | $ 144,877 | |||
| 4.a.iii | 1 | P4R | $ 983,104 | $ 163,851 | $ 163,851 | $ 523,833 | $ 523,833 | $ 564,736 | $ 564,736 | $ 250,036 | $ 250,036 | $ – | $ – | $ 10,347,156 |
| 4 | P4R | $ – | $ 163,851 | $ 163,851 | $ 349,222 | $ 349,222 | $ 847,103 | $ 847,103 | $ 1,000,142 | $ 1,000,142 | $ 819,253 | $ 819,253 | ||
| 4.b.ii | 1 | P4R | $ 933,949 | $ 155,658 | $ 155,658 | $ 497,641 | $ 497,641 | $ 536,499 | $ 536,499 | $ 237,534 | $ 237,534 | $ – | $ – | $ 9,829,798 |
| 4 | P4R | $ – | $ 155,658 | $ 155,658 | $ 331,761 | $ 331,761 | $ 804,748 | $ 804,748 | $ 950,135 | $ 950,135 | $ 778,291 | $ 778,291 | ||
| Subtotal by Payment Period | $ 18,371,962 | $ 6,123,987 | $ 6,123,987 | $ 15,086,530 | $ 17,544,258 | $ 26,384,040 | $ 26,384,040 | $ 23,362,967 | $ 23,362,967 | $ 15,309,968 | $ 15,309,968 | $ 193,364,673 | ||
| Subtotal by DSRIP Year | $30,619,936 | $32,630,788 | $52,768,080 | $46,725,933 | $30,619,936 | |||||||||
| Public Equity Guarantee | $ – | |||||||||||||
| Public Equity Performance | $ – | |||||||||||||
| Net High Performance (3%) | $ 22,219,463 | |||||||||||||
| Additional High Performance | $ 17,919,374 | |||||||||||||
| Total Valuation | $233,503,510 | |||||||||||||


Step–by–Step Example
Step 1 – Annual Funding Distribution
- DSRIP funding is not distributed evenly over the life of the waiver. Annual funding percentages, as defined in the STCs, factor into the allocation of project funding by Demonstration Year (DY).
Project 3.c.i Valuation $14,638,335 Year DY1 DY2 DY3 DY4 DY5 Funding Percentage 15.84% 16.88% 27.29% 24.16% 15.84% Funding Amount $2,318,029 $2,470,257 $3,994,715 $3,537,305 $2,318,029
Step 2 – P4R and P4P Allocation
- DSRIP annual funding is distributed by Domain and P4R and P4P payment allocation percentages in accordance with the STCs. The payment allocation percentages are applied to the funding amounts to delineate the possible payment amount per DSRIP Year.
Domain Payment Annual Domain Funding Percentages DY1 DY2 DY3 DY4 DY5 Payment P1 P2 P3 P1 P2 P1 P2 P1 P2 P1 P2 Domain 1
(Project Process Milestones)P4R 60% 10% 10% 30% 30% 20% 20% 10% 10% – – Domain 2
(System Transformation Milestones)P4P – – – – – 24% 24% 35% 35% 45.5% 45.5% P4R – 10% 10% 20% 20% 6% 6% 5% 5% 4.5% 4.5% Domain 3
(Clinical Improvement Milestones)P4P – – – 0% 24% 25% 25% 34.5% 34.5% 43.75% 43.75% P4R – 10% 10% 8% 8% 5% 5% 5.5% 5.5% 6.25% 6.25% Domain 4
(Population Health Milestones)P4R – 10% 10% 20% 20% 30% 30% 40% 40% 50% 50%
Step 3 – Allocation to P4R and P4P per DSRIP Payment Model
- Using P4R/P4P Percentages for Domain 3, potential payment amounts per payment period can be calculated.
- Valuations by project represent maximum potential payment amounts assuming PPS earns 100% of the available AVs in a quarter.
Project Domain Reporting Level DY1 DY2 DY3 DY4 DY5 Net Valuation by Project Payment 1 Payment 2 Payment 3 Payment 1 Payment 2 Payment 1 Payment 2 Payment 1 Payment 2 Payment 1 Payment 2 3.c.i 1 P4R $1,390,817 $231,803 $231,803 $741,077 $741,077 $798,943 $798,943 $353,731 $353,731 $ – $ – $14,638,335 3 P4P $ – $ – $ – $ – $592,862 $998,679 $998,679 $1,220,370 $1,220,370 $1,014,138 $1,014,138 P4R – $231,803 $231,803 $197,621 $197,621 $199,736 $199,736 $194,552 $194,552 $144,877 $144,877 Subtotal by Payment Period $1,390,817 $463,606 $463,606 $938,698 $1,531,559 $1,997,358 $1,997,358 $1,768,653 $1,768,653 $1,159,014 $1,159,014 Subtotal by DSRIP Year $2,318,029 $2,470,257 $3,994,715 $3,537,305 $2,318,029
Next Steps
PPS specific project valuation breakdown templates will be distributed to PPS leads tomorrow, October 30, 2015
|top of section| |top of page|
Follow Us