New York State Wastewater Surveillance Dashboard
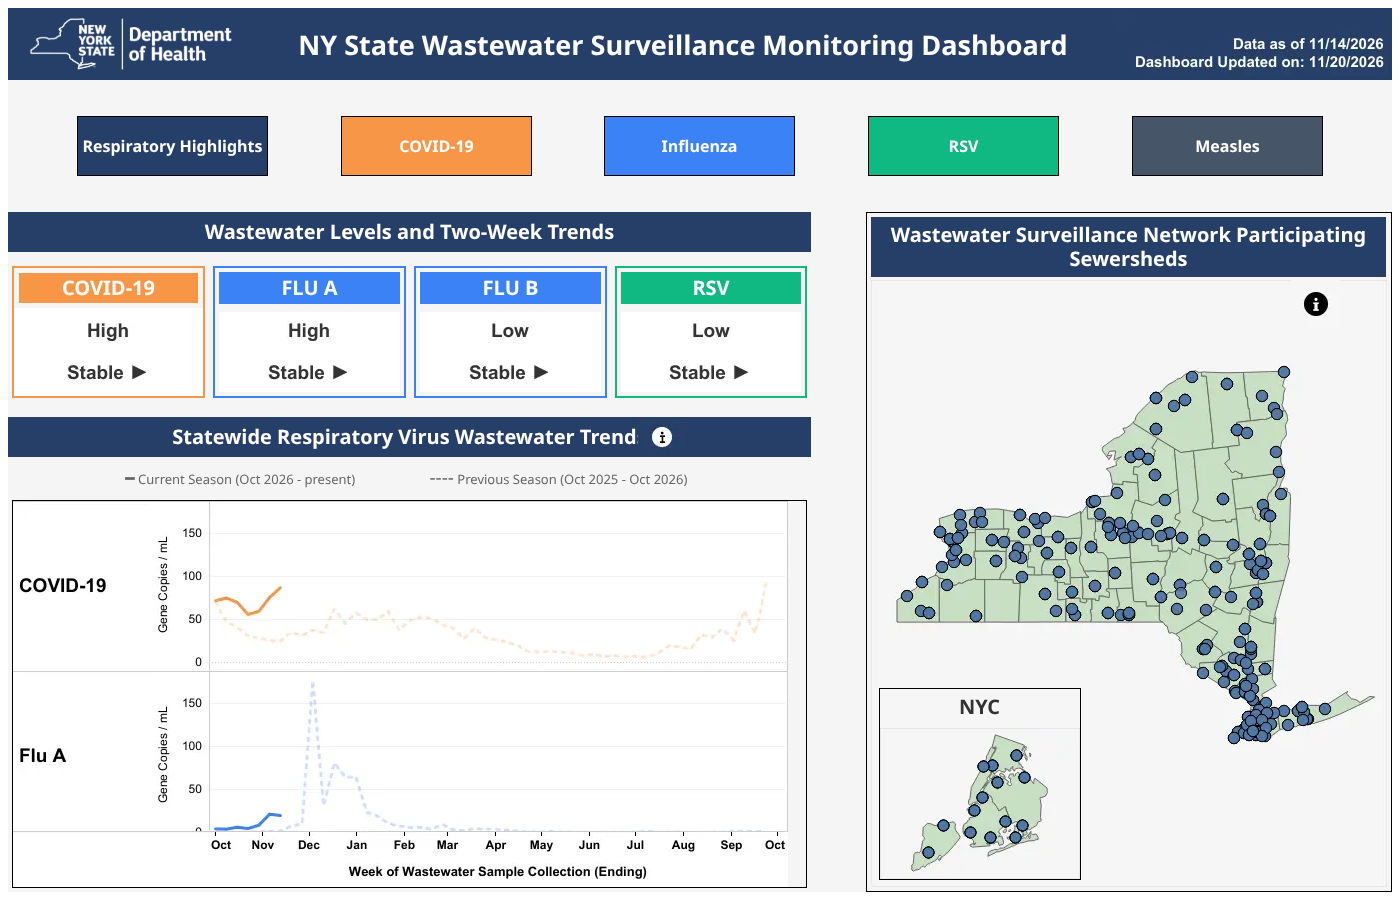
The New York State Wastewater Surveillance Network tests sewage entering wastewater treatment plants before it is cleaned and disinfected. Our dashboard reports levels of viruses found in wastewater. These results can provide a better understanding of illnesses circulating in a community. Wastewater surveillance data differs from clinical case data, which typically includes laboratory-confirmed cases and hospitalizations.
View Wastewater Data
- View the dashboard on a larger screen, such as a desktop or laptop.
- Select highlights at the top of the dashboard to view current levels and trends of respiratory viruses in wastewater across New York State. This includes COVID-19, influenza (flu), and RSV. Select an illness on the top of the dashboard to view a map of concentrations by region and county.
- Select measles to view detections across New York State and by region or county.
Data Notes
- Data are collected and analyzed as part of the New York State Department of Health Wastewater Surveillance Program.
- This dashboard is updated weekly. The date of most recent data indicates the date of sampling. There is a short delay between when the sample is collected and when it is available on the dashboard. This allows for sample collection, processing, and analysis.
- Each sewershed tests for different combinations of pathogens. Counties may only have data for certain pathogens.
- Wastewater concentration thresholds for respiratory pathogens were developed using weekly statewide concentration levels weighted by population size. Data from January 2025 – August 2026 was used to calculate metrics for high, medium, and low categories. These levels correlate with New York State’s respiratory disease clinical case levels.
- Clinical case thresholds are the same for all respiratory pathogens. However, the corresponding wastewater thresholds are different for each pathogen.
- All wastewater concentration values are measured in gene copies per milliliter (gc/mL). Gene copies are used to determine the presence of a virus in a wastewater sample.
- The number of gene copies per milliliter of wastewater is compared to low, moderate, and high thresholds for respiratory pathogens. "High" and "Very High" threshold values were combined for wastewater surveillance data analysis. This was found to better align clinical case data and wastewater surveillance data.
- The number of gene copies per milliliter of wastewater determine the presence or absence of measles in wastewater. Concentrations above 3,461.54 gene copies per milliliter of wastewater, or 1.35 gene copies per microliter of nucleic acid, signal a positive measles detection.
| Wastewater Levels* | COVID-19 (gc/mL) | RSV (gc/mL) | Flu A (gc/mL) | Flu B (gc/mL) | Clinical Level | Clinical Case Count for All Pathogens** |
|---|---|---|---|---|---|---|
| Low | 0-20 | 0-7.6 | 0-4.8 | 0-1.7 | Low | 0-7.99 |
| Moderate | 20.01-55 | 7.61-15 | 4.81-7.9 | 1.71-3.5 | Moderate | 8-19.99 |
| High | Greater than 55.01 | Greater than 15 | Greater than 7.91 | Greater than 3.51 | High | 20-39.99 |
| Very High | Greater or equal to 40 |
*Wastewater level values are measured by gene copies per milliliter (gc/mL) of wastewater.
**Clinical case count is measured in number of cases per week per 100,000 people.
Learn more about wastewater surveillance data methods.
